I would like to upgrade our unbound servers from 1.3.4 to 1.4.6. We
are currently running the service on dual-core Opteron (2 processors)
linux servers with 16 Gb RAM, peak query rate is 3500 qps per server.
For the live testing with both versions unbound was recompiled with
libev3.9 and python module(not enabled in the config currently). Four
threads are used, outgoing-range and num-queries-per-thread are set to
3072, cache sizes are set to 400/800m.
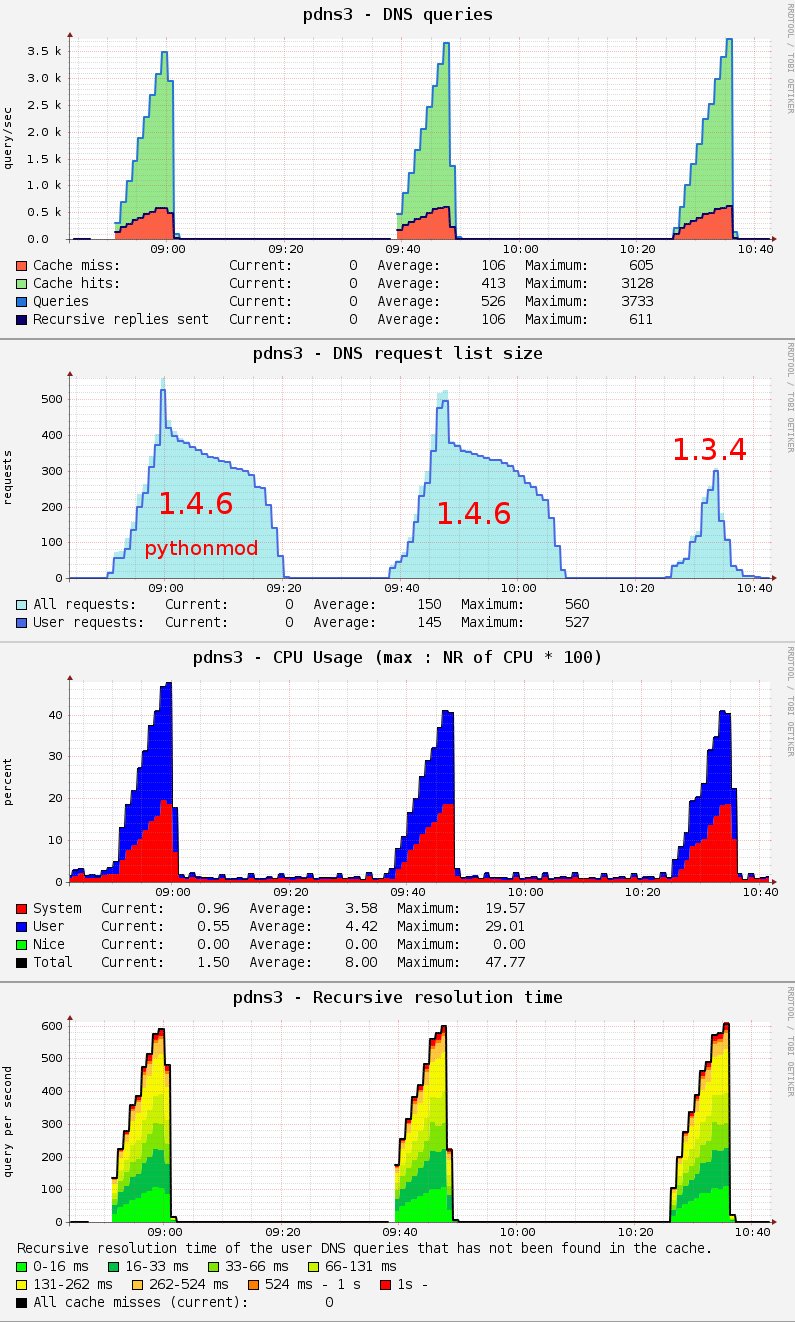
With the 1.3.4 version during the busy hour the request list contains
120 entries in average, with a variance of 80-180 roughly. In the
early hours it goes down to 20 (10-30). After the change to the new
1.4.6 version, the size of the requestlist has increased, it is at
least 2 times higher, but occasionally it goes up to 500-600
continuously for 1-2 hours, with higher (1500) peaks.
Only the running unbound binary has changed on the test system, apart
from this everything is the same on the server in both cases. Also the
values of the other performance counters stayed on the same level (CPU
usage, recursion times, DNS query counters and so on)
I would like to know the reason of this difference between the two
software versions. I have looked through the release notes, but I
cannot obviously decide whether or not it is only a symptom of one of
the software changes.
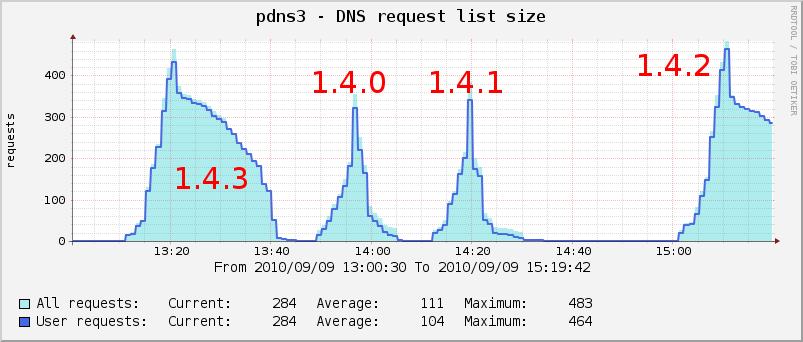
I have attached four graphs with the result of a test I have made today.
I have sent continuously increasing amount (max 4000) of DNS queries
for 10 minutes with the "resperf" tool, 3 times, running 2 different
Unbound binaries.
The resperf tool has used a long list of DNS queries collected from
our subscriber traffic recently.
Results on the graph:
1. - 1.4.6 and python module enabled in the config (a small python
script has modified the results of approx 1% of the queries).
2. - 1.4.6 without pythonmod
3. - 1.3.4 (also without pythonmod)
As you can see there is a significant difference in the request list
size and in the removal time of the old entries in the 2nd and 3rd
case.
Can anybody explain it to me what is the reason of this difference?
Is there any possibility to influence the requestlist processing in
the config?
Can you do some more tests to find the version number where this change
happens?
Can you give an unbound-control dump_requestlist with 1.4.6; when it is
full; and then we can see which domain names are filling up the requestlist?
The things I can think of that have changed and may be relevant, are
EDNS probe handling (different caching of no-EDNS support to improve
DNSSEC resolutions), and misconfigured-domain-handling.
No, this did not exist in 1.3.4, thus it is not enabled for him.
I suspect this change:
18 February 2010: No more blacklisting of unresponsive servers, a 2
minute timeout is backed off to.
And I saw that the requestlist he included is full of unresponsive
servers. This fits with the graphs he sent, that see no increase in CPU
(it does not do anything but waiting) with extra entries (thus those
entries are on a long timeout).
Looks like a tradeoff between how much work to put into trying to
resolve to bad servers (: 16 lost packets, huge timeout). Otherwise the
server used to be blacklisted for 15 minutes (infra-ttl).
Thanks to good testing by Peter Bagari, I got the clues:
The issue is found out to be this, unbound-control lookup ..
67.228.190.60 rtt 120024 msec, 0 lost. EDNS 0 probed.
70.38.5.34 rtt 120012 msec, 0 lost. EDNS 0 probed.
These servers timeout on some names (nxdomains), but answer validly and
quickly for good names (www.yi.org). This is a misconfiguration of the
server or some firewall. Such behaviour is also seen based on query
type, such as type=MX, for other servers.
The rtt of 120000 and 0 lost indicates that this is the problem.
Unbound is trying to contact a lot of those names, but does not
immediately throw away the query, because www.yi.org might work right away.
Version 1.3.4 would fail to resolve www.yi.org in this situation, but
1.4.2 makes this work. Here unbound is doing a lot of effort to resolve
the query. It also has the resources.
If resources get thin, then long-running queries are jostled out to make
space for faster queries.
It seems there is nothing to fix. It is possible to identify the
situation in the program - rtt 120000 and 0 lost - but the only thing
that I can do is try, because sometimes the server answers. There is
already code there to defend the requestlist resource...